RSI divergence is a way to spot potential changes in an asset’s price trend by comparing its price movements to the Relative Strength Index (RSI). Here’s a simpler breakdown:
- RSI Overview: The RSI is a tool that shows whether an asset is overbought or oversold by measuring the speed and size of price changes.
- Divergence: This happens when the price of the asset and the RSI move in different directions. For example, if the price is going up but the RSI is going down, it might signal a potential change in the trend.
- Why It Matters: Divergence can suggest that the current price trend may be weakening, which might lead to a reversal or a change in the trend.
So, in simple terms, if the price and RSI aren’t moving in sync, it could be a sign that a change in the trend might be coming.
Types of RSI Divergence
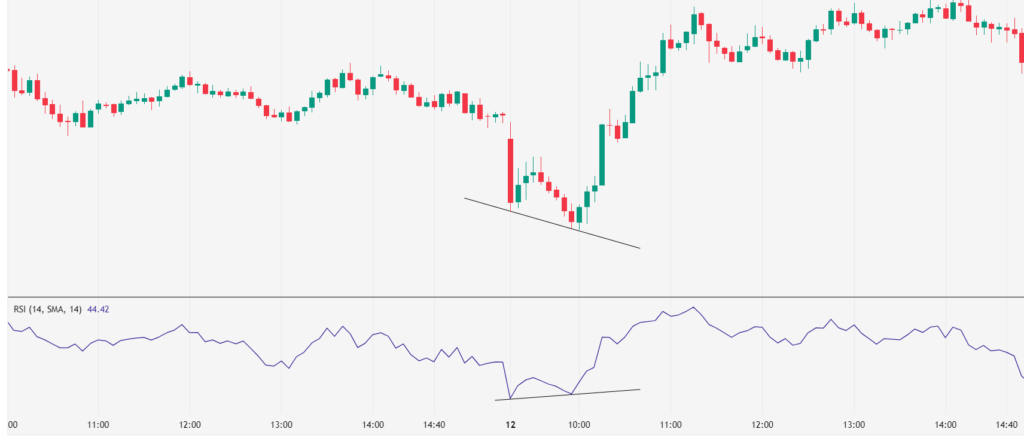
Bullish Divergence: This Occurs when the price makes a lower low, but the RSI makes a higher low or a flat signal. This suggests that the selling pressure is weakening, and a reversal to an upward trend may be imminent.
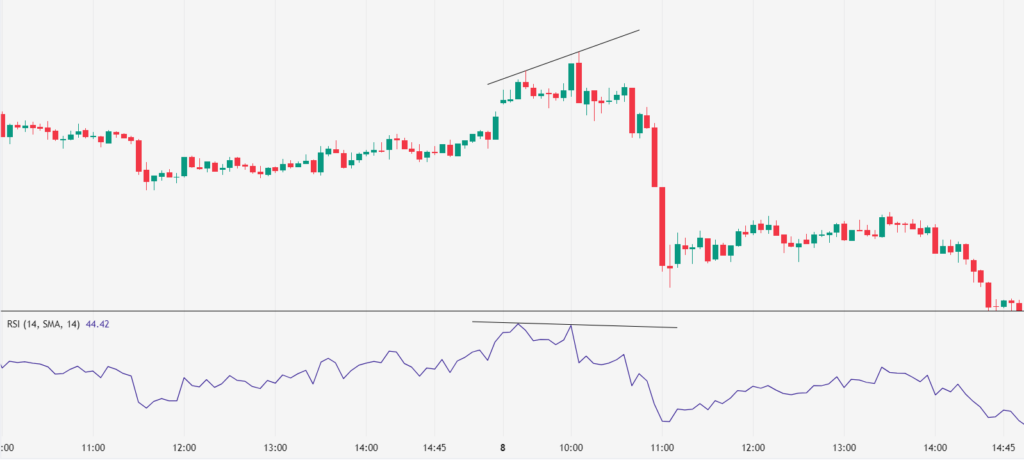
Bearish Divergence: This occurs when the price makes a higher high, but the RSI makes a lower high or a flat signal. This indicates that the buying pressure is weakening, and a reversal to a downward trend may occur.
How to Use RSI Divergence
Identify Divergence:
- Plot the RSI indicator (typically set at a 14-period) on your price chart.
- Look for discrepancies between the price action and the RSI indicator.
Confirm with Other Indicators:
- Use other indicators like moving averages, MACD, or candlestick patterns to confirm the divergence signal.
- Check for changes in trading volume that may support the potential reversal or continuation.
- You can also check the candlestick pattern to confirm the divergence signal.
Execute the Trade:
- For bullish divergence, consider entering a long position once the price starts to confirm the upward reversal.
- For bearish divergence, consider entering a short position once the price starts to confirm the downward reversal.
Risk Management:
- Protect your trades with stop-loss orders to minimize losses if the market moves against your prediction.
- Set profit targets based on support and resistance levels or other technical indicators.
Example of RSI Divergence
Below is the example of bullish and bearish RSI divergence strategies.
Bullish Regular Divergence:

Price Action: The price makes a lower low.
RSI Indicator: The RSI makes a higher low.
Interpretation: The selling pressure is weakening, indicating a potential reversal to the upside.
Action: Consider entering a long position after confirmation of the reversal.
Bearish Regular Divergence:

Price Action: The price makes a higher high.
RSI Indicator: The RSI makes a lower high.
Interpretation: The buying pressure is weakening, suggesting a potential reversal to the downside.
Action: Consider entering a short position after confirmation of the reversal.
Tips for Using RSI Divergence Effectively
Look for Strong Signals: Divergence is more significant on higher time frames and when combined with other indicators.
Confirmations are Key: Always wait for additional confirmation signals before acting on divergence.
Risk Management: Implement robust risk management strategies to mitigate potential losses.
RSI divergence is a powerful tool for traders seeking to anticipate market shifts. When used alongside other technical analysis methods, it enhances trading decisions by providing insights into potential price reversals or continuations. Mastering RSI divergence requires practice and a keen eye for interpreting market signals

Leave a Reply